
Typhoon with cliamte change

Typhoon interactive map from 2001
Relationship between SST Rise and Typhoon Intensity
Data was obtained from the Korea Meteorological Administration(KMA) and the Copernicus Climate Data Store for analysis.
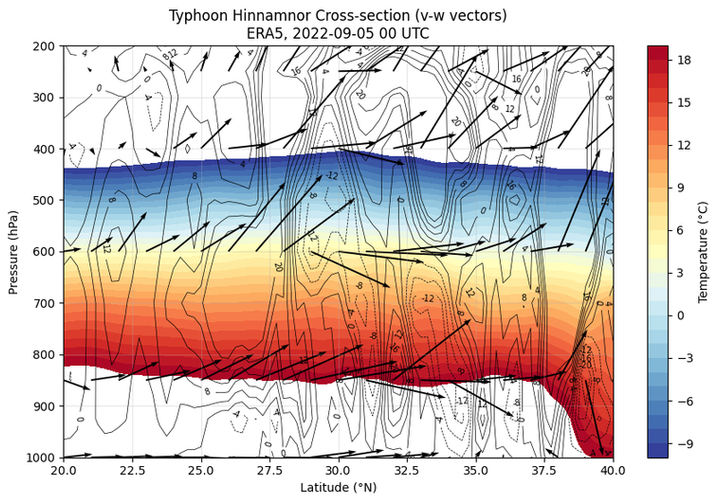
The warm core structure at the typhoon's center is clearly visible in the temperature cross-section.
Vertical velocity and wind vectors indicate the presence of strong updrafts and upper-level outflow near the center.
This represents the typical axisymmetric warm-core structure of a strong tropical cyclone, signifying its development into a powerful typhoon.
Typhoon intensity


The visual comparison of the 500hPa geopotential height reveals a significant westward expansion of the North Pacific High in recent years (2015-2024) compared to the past decade (2001-2010). This expanded high-pressure system acts as a formidable barrier, preventing typhoons from recurving eastward and instead steering them directly toward the Korean Peninsula.
Expansion of the North Pacific High
Increasing SST
The visualization indicates a significant increase in Sea Surface Temperatures (SST) around the Korean Peninsula compared to the past. Higher SSTs increase the Ocean Heat Content (OHC), providing thermodynamic energy to typhoons. This condition allows typhoons to maintain their intensity even at higher latitudes without rapid dissipation.

June 2024 Sea Surface Temperature and 10-Year Average Sea Surface Temperature
June average 10-year average


July 2024 Sea Surface Temperature and 10-Year Average Sea Surface Temperature
July average 10-year average


August 2024 Sea Surface Temperature and 10-Year Average Sea Surface Temperature
August average 10-year average


September 2024 Sea Surface Temperature and 10-Year Average Sea Surface Temperature
September average 10-year average


October 2024 Sea Surface Temperature and 10-Year Average Sea Surface Temperature
October average 10-year average


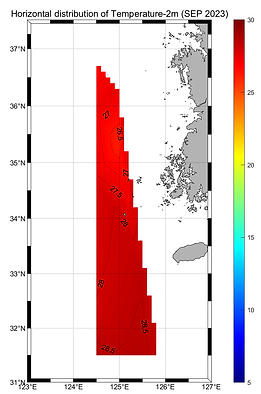
In both 2023 and 2024, SST near the Korean Peninsula during the typhoon peak season (August–September)is higher than the 10-year average.
Particularly in September 2023 and 2024, the high-temperature zone in the East China Sea–South China Sea region extended northward,creating an environment where strong typhoons could easily draw energy right up until landfall.
2018–2024 Water Temperature Spatial Distribution Map & Vertical Cross-Section
2018 September
Water Temperature Spatial Distribution Map


Vertical cross-section


2019 September


2020 September


2021 September


2022 September


2023 September


2024 September


The summer–autumn surface water temperature distribution from 2018 to 2024 shows that high-temperature zones exceeding 25–28°C repeatedly formed south of the Korean Peninsula and in the East China Sea.
Vertical cross-sections also show warm water thickly distributed up to the upper 20–30m layer,
limiting the sharp temperature drop caused by cold water upwelling during typhoon passage.
This increase in upper-ocean heat content is physically linked to the recent rise in the frequency of strong typhoons.
NOAA OISST 2021–2024
August-October SST
2021 August-October


2022 August-October


2023 August-October


2024 August-October


SSTs observed by NOAA OISST from August to October 2021–2024 show a tendency to be higher than normal across the entire northwest Pacific.
Extensive high-temperature zones formed particularly in the Kuroshio Extension (south of Japan), the East China Sea, and the South China Sea,
where strong typhoons such as Chanthu (2021), Hinnamnor (2022), and Khanun (2023) originated and intensified during this period.
This suggests the possibility that recent strong typhoons may be associated with a systemic change linked to rising SST.

Our analysis of typhoon tracks categorized by the Arctic Oscillation (AO) phase reveals a distinct pattern. During the Negative AO phase, the weakening of the polar vortex causes the jet stream to meander. This meridional flow pattern creates an atmospheric environment that steers typhoons toward the Korean Peninsula. Conversely, during the Positive AO phase, the strong zonal jet stream tends to restrict northward movement, keeping typhoon tracks primarily in the open Pacific Ocean.